

Algebraic Functions are those functions which involve the sum or difference of algebraic
terms. The following are some different types of algebraic functions.
a. Constant funciton
b. Identity function
c. Linear function
d. Quadratic function
e. Cubic function
********************
10 Math Problems officially announces the release of Quick Math Solver and 10 Math Problems, Apps on Google Play Store for students around the world.

********************

********************
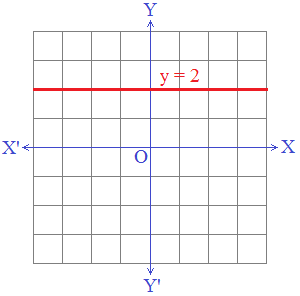
a. Constant Function
A function f : A → B is said to be a constant function if for every x ∈ A, there
is the same image in B. i.e. for all x ∈ A, y = f(x) = c, where c
is a constant and c ∈ B.
For example, f = {(1, 2), (2, 2), (8, 2)} is a constant
function. In this case, the range of f will always be a singleton set.
The constant function f : R → R defined by f(x) = 2 is shown in
the graph given below.
b. Identity Function
A function f : A → A is said to be an identity function if for all x ∈ A, y = f(x) = x. Or, a
function f defined by f(x) = x is called an identity function. It maps every
element into itself. In an identity function, every element in the domain has the same image in the range.
For example: A = {1, 2, 3, 4}, f : A → A is defined as f = {(1,
1), (2, 2), (3, 3), (4, 4)}.
Here,
For x = 1, y = f(1) = 1
For x = 2, y = f(2) = 2
For x = 3, y = f(3) = 3
For x = 4, y = f(4) = 4
∴ f satisfies y = f(x) = x, so f is an identity function.
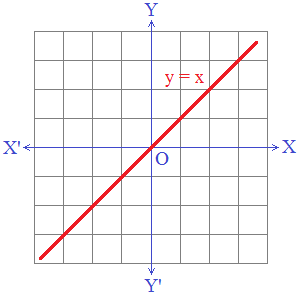
The graph of an identity function is a straight line y = x. In y
= mx + c, if m = 1 and c = 0 then it is an identity function.
The identity function f : R → R defined by f(x) = x is shown in
the graph given below.
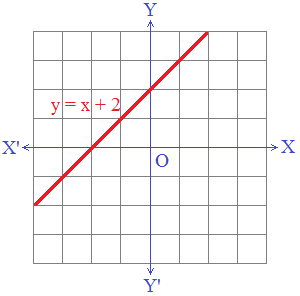
c. Linear Function
A function f : A → B is said to be a linear function if for all x ∈ A, y ∈ B, it can be expressed in the form of y = f(x) = mx + c, m and
c being constants. For example, f : A → B is defined as y = f(x) = x + 2 where
A = {1, 2, 3} and B = {3, 4, 5}.
In this case, if we draw the graph of the function, all the
ordered pairs will lie in a straight line.
The linear function f : R → R defined by f(x) = x + 2 is shown
in the graph given below.
d. Quadratic Function
A function f : A → B is said to be a quadratic function if for every x ∈ A, y ∈ B, it can be expressed in the form of y = f(x) = ax2
+ bx + c, where a ≠ 0, b and c are constants. For example, y = f(x) = x2,
y = f(x) = 2x2 – 3x + 1 etc. are quadratic functions.
To draw the graph of quadratic function accurately, we need to have some points to plot on a graph. Let us take a quadratic function y = f(x) = x2. For the graph of this quadratic function, let us find some values of x and y.
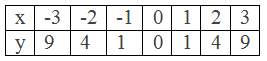
These are the points to plot: (-3, 9), (-2, 4), (-1, 1), (0, 0),
(1, 1), (2, 4), (3, 9). And, the function y = f(x) = x2 is shown in
the graph given below. It is a curve named parabola.
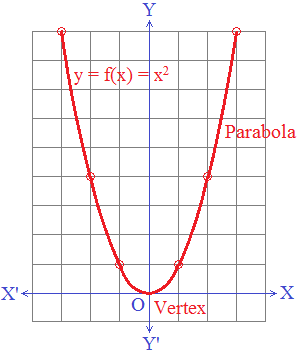
Parabola: The smooth curve obtained by the graph of a quadratic
equation is called the parabola.
Vertex: The turning point of the parabola is called its vertex.
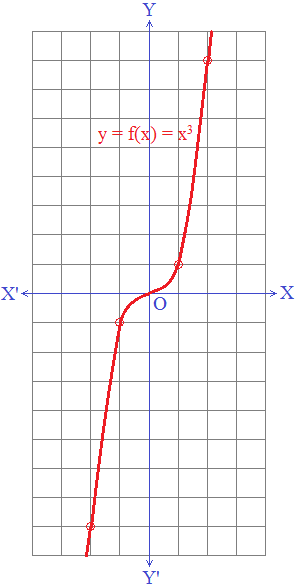
e. Cubic Function
A function f : A → B is said to be a cubic function if for all x ∈ A, y ∈ B, it can be expressed in the form of y = f(x) = ax3
+ bx2 + cx + d, where a ≠ 0 and a, b, c, and d are constants. For
example, y = f(x) = x3, y = f(x) = x3 – 3x + 2 etc. are
cubic functions.
A graph of a cubic equation is illustrated in the following
example.
Consider a cubic equation y = x3.
Here, y = x3
Choose values and draw the value table
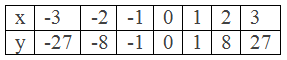
These are the points to plot: (-3, -27), (-2, -8), (-1, -1), (0,
0), (1, 1), (2, 8), (3, 27)
The function f(x) = x3 is shown in the graph given below.
0 comments: