Graphs of Trigonometric Functions
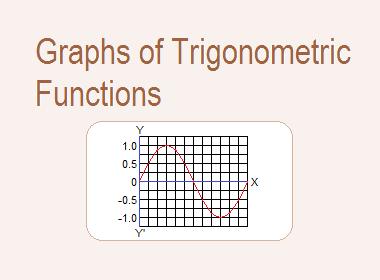
To each angle x, there corresponds a unique value for the trigonometric ratios and hence the trigonometric ratios such as sinx, cosx, tanx including the reciprocal ratios are the functions of the angle x.
********************
10 Math Problems officially announces the release of Quick Math Solver and 10 Math Problems, Apps on Google Play Store for students around the world.
********************
********************
A function can be represented in various
ways. One of the important ways by which a function can be represented is the graph. In a trigonometric function, the variable is the angle. For different
values of the angle, the values of the trigonometric ratios will be different.
To draw the graph of a trigonometric function, we take the angle x along the X-axis and the value of trigonometric ratio sinx, cosx, tanx, etc. along the Y-axis. Taking different values of the angle as the x-coordinates, and the corresponding values of the trigonometric ratio as y-coordinates, we plot the points (x, sinx), etc. on the plane with rectangular axes. Then we join these points freely to get the required graph of the trigonometric function.
Consider a circle with radius r placed in standard position. Let a revolving line OP start from OX and trace out an angle XOP = x°. Draw perpendicular PM from P to the X-axis.

1st
quadrant:
OP revolves from OX to OY, x varies from
0° to 90°, MP varies from 0 to r, MP is positive, OM varies from r to 0, and OM
is positive.
2nd
quadrant:
OP revolves from OY to OX’, x varies from
90° to 180°, MP varies from r to 0, MP is positive, OM varies from 0 to – r and
OM is negative.
3rd
quadrant:
OP revolves from OX’ to OY’, x varies
from 180° to 270°, MP varies from 0 to – r, MP is negative, OM varies from – r
to 0 and OM is negative.
4th
quadrant:
OP revolves from OY’ to OX, x varies from 270° to 360°, MP varies from – r to 0, MP is negative, OM varies from 0 to r, OM is positive.
Graph of Sine Function (Sine Graph)
The sine function is defined by y = sinx = MP/OP = MP/r.
When x varies from 0° to 90°, y = sinx
varies from 0 to 1 because MP varies from 0 to r. When x varies from 90° to
180°, y = sinx varies from 1 to 0 because MP varies from r to 0. When x varies
from 180° to 270°, y = sinx varies from 0 to – 1 because MP varies from 0 to –
r. When x varies from 270° to 360°, y = sinx varies from – 1 to 0.
Some standard values of x and the corresponding values of sinx are given in the table below:

Plotting these values in the graph paper, we get the following graph of the sine function (Sine Graph).

If we study this sine curve, we will get the following facts:
(i)
y = sinx attains the maximum
value at 90° and minimum value at 270°. The maximum and minimum value of sinx
are 1 and – 1 respectively. So y = sinx oscillates in the limit – 1 to 1.
(ii) y = sinx has positive values in the first and second quadrants where the graph is above the X-axis and negative values in the third and fourth quadrants where the graph is below X-axis.
Graph of Cosecant Function (Cosecant Graph)
Similarly, we can have the table of trigonometric values and graph of the reciprocal of sine function i.e cosecant function (y = cosecx) as given below:

Plotting these values in the graph paper, we get the following graph of the cosecant function (Cosecant Graph).

Graph of Cosine Function (Cosine Graph)
The cosine function is defined by y =
cosx = OM/OP = OM/r.
When x increases from 0° to 90°, cosx
decreases from 1 to 0 as OM decreases from r to 0. When x increases from 90° to
180°, cosx decreases from 0 to – 1 because OM changes 0 to – r. When x changes from 180° to 270°, cosx changes from
– 1 to 0. Similarly, when x increases from 270° to 360°, cosx increases from 0
to 1.
Some standard values of x and the corresponding values of cosx are given in the table below:

Plotting these values in the graph paper, we get the following graph of the cosine function (Cosine Graph).

If we study this cosine curve, we will get the following facts:
(i)
y = cosx attains the maximum
value at x = 0° and 360° and minimum value at 180°. The maximum and minimum
value of cosx are 1 and – 1 respectively. So y = cosx oscillates in the limit –
1 to 1.
(ii) y = cosx has positive values in the first and fourth quadrants where the graph is above the X-axis and negative values in the second and third quadrants where the graph is below X-axis.
Graph of Secant Function (Secant Graph)
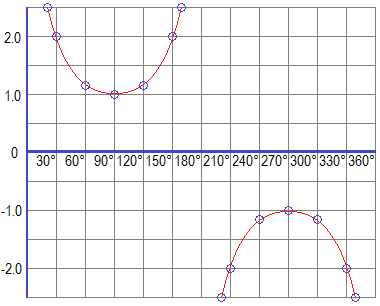
Similarly, we can have the table of trigonometric values and graph of the reciprocal of cosine function i.e secant function (y = secx) as given below:

Plotting these values in the graph paper, we get the following graph of the secant function (Secant Graph).

Graph of Tangent Function (Tangent Graph)
The tangent function is defined by y =
tanx = MP/OM
When x increases from 0° to 90°, tanx
increases from 0 to ∞ (infinity) because MP changes from 0 to r and OM changes
from r to 0. When x increases from 90° to 180°, tanx changes from - ∞ to 0
because MP changes from r to 0 and OM changes from 0 to – r. When x increases
from 180° to 270°, tanx changes from 0 to ∞ because MP changes from 0 to – r, and OM changes from – r to 0. When x increases from 270° to 360°, tanx changes
from - ∞ to 0 because MP changes from – r to 0 and OM changes from 0 to r.
Some standard values of x and the corresponding values of tanx are given in the table below:


y = tanx has positive values in the first and third quadrants where the graph is above X-axis and negative values in the second and fourth quadrants where the graph is below X-axis. The maximum and minimum values of tanx cannot be defined.
Graph of Cotangent Function (Cotangent Graph)
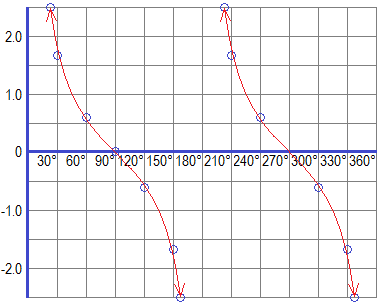
Similarly, we can have the table of trigonometric values and graph of the reciprocal of tangent function i.e cotangent function (y = cotx) as given below:

Plotting these values in the graph paper, we get the following graph of the cotangent function (Cotangent Graph).

Do you have any questions regarding the graph of a trigonometric function?
You can ask your questions or problems here, in the comment section below.


0 comments: