The probabilities of all possible
outcomes of a series of trials of a random experiment can be shown by a diagram
called probability tree diagram.
Every branch of a tree diagram shows the probability of the respective event in a
particular trial.
********************
10 Math Problems officially announces the release of Quick Math Solver and 10 Math Problems, Apps on Google Play Store for students around the world.
********************
********************
From a tree diagram, the probability of a particular event of a random experiment can be obtained as the product of the probabilities of the event in different trials along the path of the event.
The probability of independent and
dependent events can be calculated by using their tree diagram. Let’s study the
following examples.
Worked out examples on probability tree diagram:
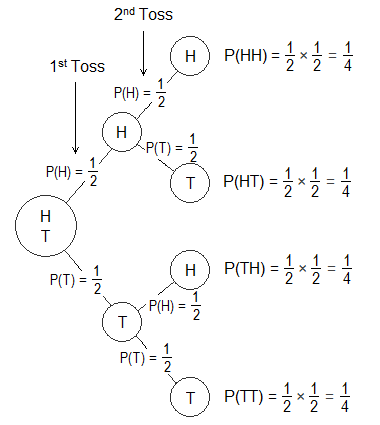
Example 1: If a coin is tossed two times, show the probabilities of all events
in a tree diagram.
Solution:
Let, H and T represent the head and tail of a coin.
n(H) = 1
n(T) = 1
n(S) = 1 + 1 = 2
It is the case of independent events.

From the tree diagram,
The probability of both head = P(HH) = ½ × ½ = ¼
The probability of first head and second tail = P(HT) = ½ × ½ =
¼
The probability of first tail and second head = P(TH) = ½ × ½ =
¼
The probability of both tail = P(TT) = ½ × ½ = ¼
Example 2: Two children were given birth by a married couple at the interval
of four years. Illustrate the probabilities of son or daughter by drawing a
tree diagram and calculate the probability of both are girls.
Solution:
Let, S be the event of son and D be the event of a daughter.
n(S) = 1
n(D) = 1
Total number of possible outcomes = 1 + 1 = 2
It is the case of independent events.

From the tree diagram,
The probability of both are girls = P(DD) = P(D) × P(D) = ½ × ½
= ¼
So, the probability of both are girls is ¼.
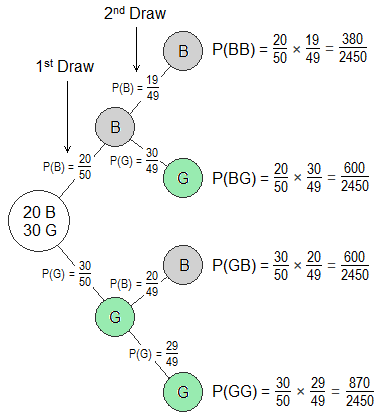
Example 3: There are 20 boys and 30 girls in a class. If two students are
selected at random, show the probability of selecting a boy and a girl by
drawing a tree diagram.
Solution:
Let, B and G denote boy and girl student respectively.
n(B) = 20
n(G) = 30
Total number of students, n(S) = 20 + 30 = 50
It is the case of dependent events.

From the tree diagram,
The probability of selecting a boy and a girl = P(BG or GB)
= P(BG) + P(GB)
= 600 / 2450 + 600 / 2450
= 1200 / 2450
= 24 / 29
So, the probability of selecting a boy and a girl is 24 / 29.
Solution:
Let, B and W denote the occurrence of black and white ball.
n(B) = 5
n(W) = 4
Total number of balls, n(S) = 5 + 4 = 9
Two balls are drawn randomly one after another without
replacement. So, It is the case of dependent events.

From the tree diagram,
(i) Probability of at least
one white ball = P(BW or WB or WW)
= P(BW ∪ WB ∪ WW)
= P(BW) + P(WB) + P(WW)
= 5 / 18 + 5 / 18 + 1 / 6
= 13 / 18
So, the probability of getting at least one white ball is 13 / 18.
(ii) Probability of none of
white balls = P(BW ∪ WB ∪ WW)c
= 1 - P(BW ∪ WB ∪ WW)
= 1 – 13 / 18
= 5 / 18
So, the probability of getting none of the white balls is 5 / 18.
Example 5: There is one red, one blue, and one white ball in a bag. Two balls
are drawn randomly one after another without replacement. Write the sample
space of the experiment using a tree diagram and find the probability of
getting at least one red ball.
Solution:
Let R, B and W denote the red, blue and white ball.
n(R) = 1
n(B) = 1
n(W) = 1
No. of possible outcomes, n(S) = 1 + 1 + 1 = 3
Two balls are drawn randomly one after another without
replacement. So, It is the case of dependent events.

From the tree diagram,
The sample space, S = {RB, RW, BR, BW, WR, WB}
The probability of getting at least one red ball = P(RB or RW or
BR or WR)
= P(RB) + P(RW) + P(BR) + P(WR)
= 1 / 6 + 1 / 6 + 1 / 6 + 1 / 6
= 4 / 6
= 2 / 3
So, the probability of getting at least one red ball is 2 / 3.
Do you have any questions regarding the Probability Tree Diagram?


A dice is rolled and a coin is tossed draw a tree diagram and find the probability that dice lands on odd number and coin on head
ReplyDelete