
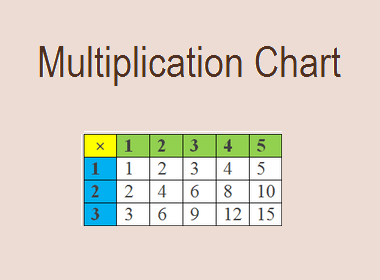
A multiplication chart,
also known as a times table or multiplication table, is a visual tool that
displays the products of numbers from 1 to a certain range, typically up to 10
or 12. It is organized in a grid format with the numbers listed along the top
and left sides. The chart shows the results of multiplying the numbers in each
row with the numbers in each column, resulting in a grid of multiplication
facts. Each cell in the chart represents the product of the corresponding row
and column numbers.

Follow Us